(Or, the week I finally went off the hipster deep end)
About six months ago, I read Tobias Toft’s excellent article “An intro to Pen Plotters”. Inspired by the wonderful art he demonstrated, I set out to get my own plotter - a drawing robot from the pre-printer age - to play with.
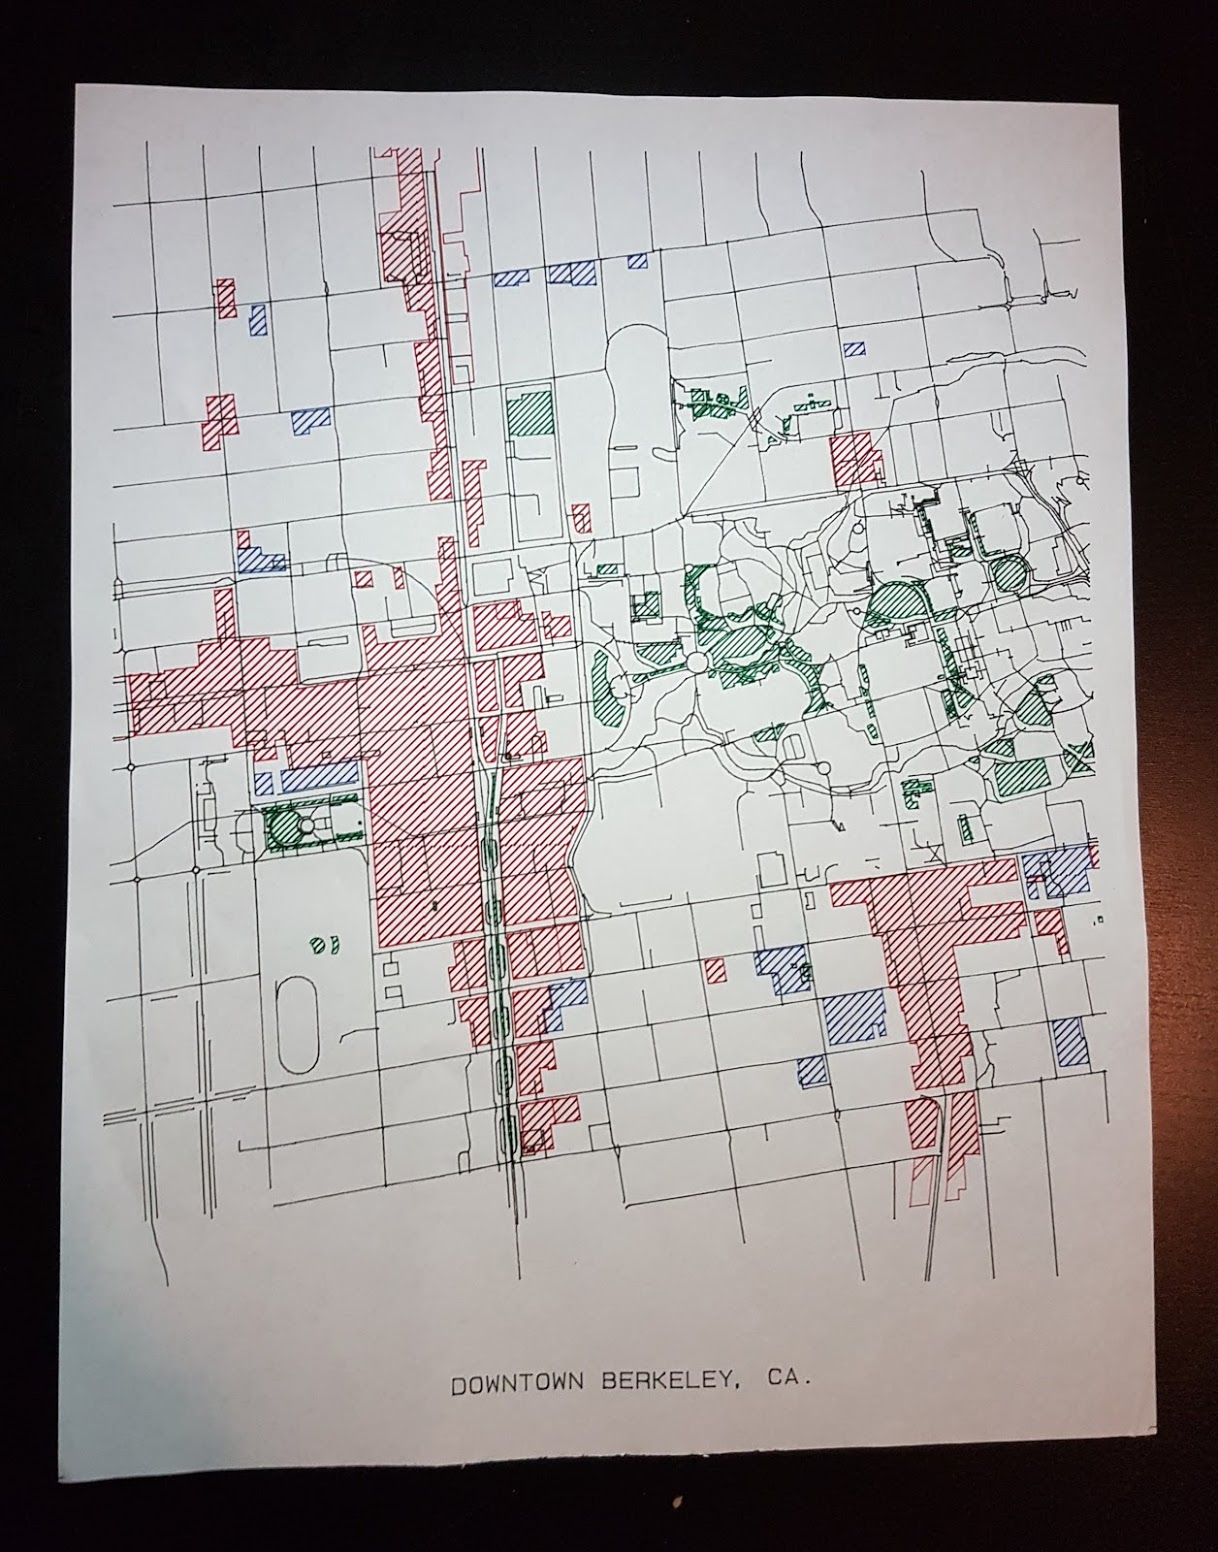
This is the story of my first experiment with pen plotters – plotting a land-use map of Downtown Berkeley:
Setting up and using an HP 7475A plotter
I took Tobias’s advice and took to eBay to look for HP 7xxx-series plotters. I found a cheap HP 7475A that looked to be in good condition, and eagerly awaited its arrival … only to discover that I hadn’t been careful enough in looking at the listing and that the plotter came with the dreaded HP-IB port:

I didn’t know this at the time, but it turns out the that HP 7475A was one of the few HP pen plotters that came in two models: one with a forward-compatible serial port and one with a backward-compatible HP-IB port. Not having any idea what to do with this strange plug (it’s not 1985 anymore, after all), I turned to the internet and discovered a post that began a sentence with “FWIW, if you have an HP-IB plotter, you should probably just hack an Arduino into the motor control connections…” Yikes, that’s a bit more than I’d signed up for.
Fortunately, the eBay seller was understanding and let me return the HP-IB plotter. Eventually I managed to find an HP 7475A with a serial port. From there, I was able to follow Tobias’s instructions. I got a null modem cable and a serial-to-USB converter cable and plugged the plotter into my Macbook.
I tested the plotter out by sending some commands over Coolterm, but found it pretty finicky. After trying a few different terminal emulators and plotting utilities, I discovered the excellent Chiplotle library, and have been using it ever since. For interactive plotting I load the chiplotle shell, and for quickly plotting HPGL files created separately I use the plot_hpgl_file.py script.
Loading and Exporting Shapefiles
The first step to plotting a map is loading the appropriate shapefile in a GIS environment (I use the open-source QGIS) and exporting each desired layer as PDF. I followed the instructions in the “Preparing Data” section of the QGIS tutorial to load a map of Berkeley from OpenStreetMap:
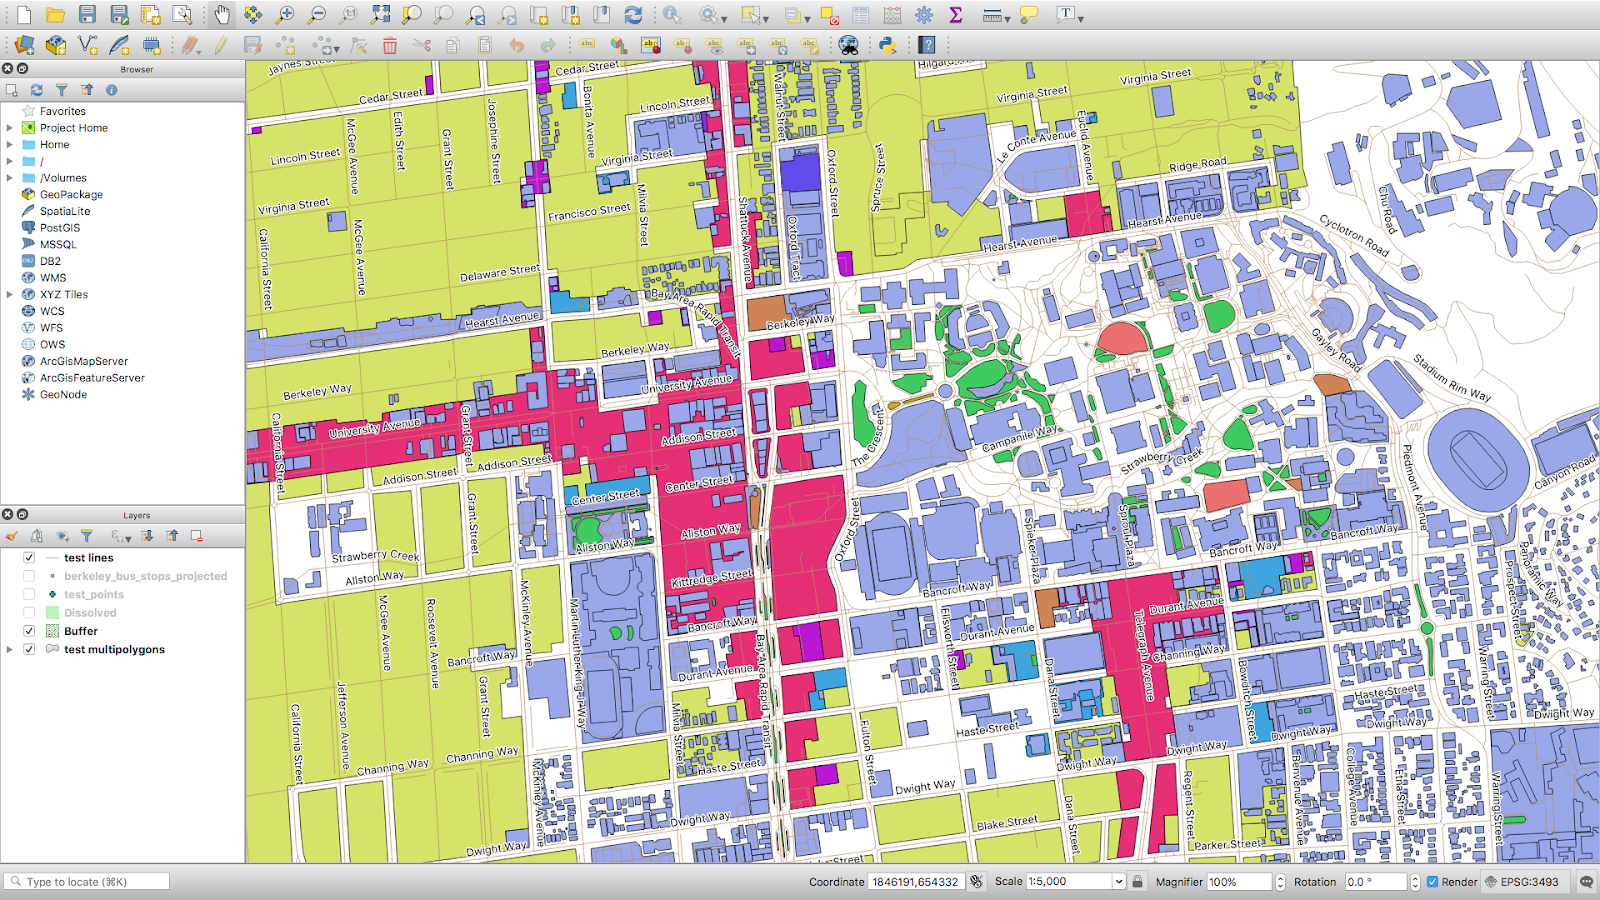
From there, I exported a PDF for each layer I was interested in:
roads.pdfis the set of lines (roads, train tracks, paths, etc) with labels removedcomm.pdfis the union of the “commercial” and “retail” polygon layersinst.pdfis the “institutional” polygon layer (admittedly this layer doesn’t have a lot in it)green.pdfis the union of the “farmland”, “forest”, “grass”, and “recreational_ground” polygon layers
Initially I separately exported the “residential” layer as well, but I found that it cluttered up the map too much. There is also a layer consisting of all structures, which likewise would have been cool to use (in particular, it would have made the university grounds on the right side look less sparse) but likewise it caused too much clutter.
I selected each layer (or set of layers) in turn and exported to PDF (Project | Export to PDF), being careful to preserve the exact same dimensions and map coordinates between each PDF.
Converting PDF -> HPGL
Now that I had a bunch of PDFs, I needed to convert them to the HPGL format for plotting. I couldn’t find any way to convert PDF -> HPGL in one operation, and settled for converting PDF -> PS using pdf2ps and PS -> HGPL using pstoedit.
I wrote a simple pdf2hpgl.sh script that, given a list of pairs of PDF file paths and pen numbers (for example, pdf2hpgl.sh roads.pdf 3 comm.pdf 5 inst.pdf 4 green.ps 2), converts each PDF file into an HPGL file, changes all SP (select pen) commands to use the given pen number (instead of the more-or-less random pen selections made by pstoedit), and concatenates the result together into one big HPGL file:
#!/usr/bin/env bash
# Requires pdf2ps and pstoedit.
OUTPUT_FILE="out.hpgl"

rm $OUTPUT_FILE

while (( "$#" >= 2 )); do
  PNG_FILE=$1
  PEN=$2
  shift 2

  PS_FILE="${PNG_FILE%.*}.ps"
  HPGL_FILE="${PNG_FILE%.*}.hpgl"

  pdf2ps $PNG_FILE $PS_FILE
  pstoedit -f plot-hpgl $PS_FILE $HPGL_FILE
  cat $HPGL_FILE \| sed -e "s/SP[0-9]*;/SP$PEN;/g" >> $OUTPUT_FILE

  rm $PS_FILE
  rm $HPGL_FILE
done
And voila, we now have an HPGL file that we can send directly to the plotter.
Here’s what it looks like with just the roads layer plotted:
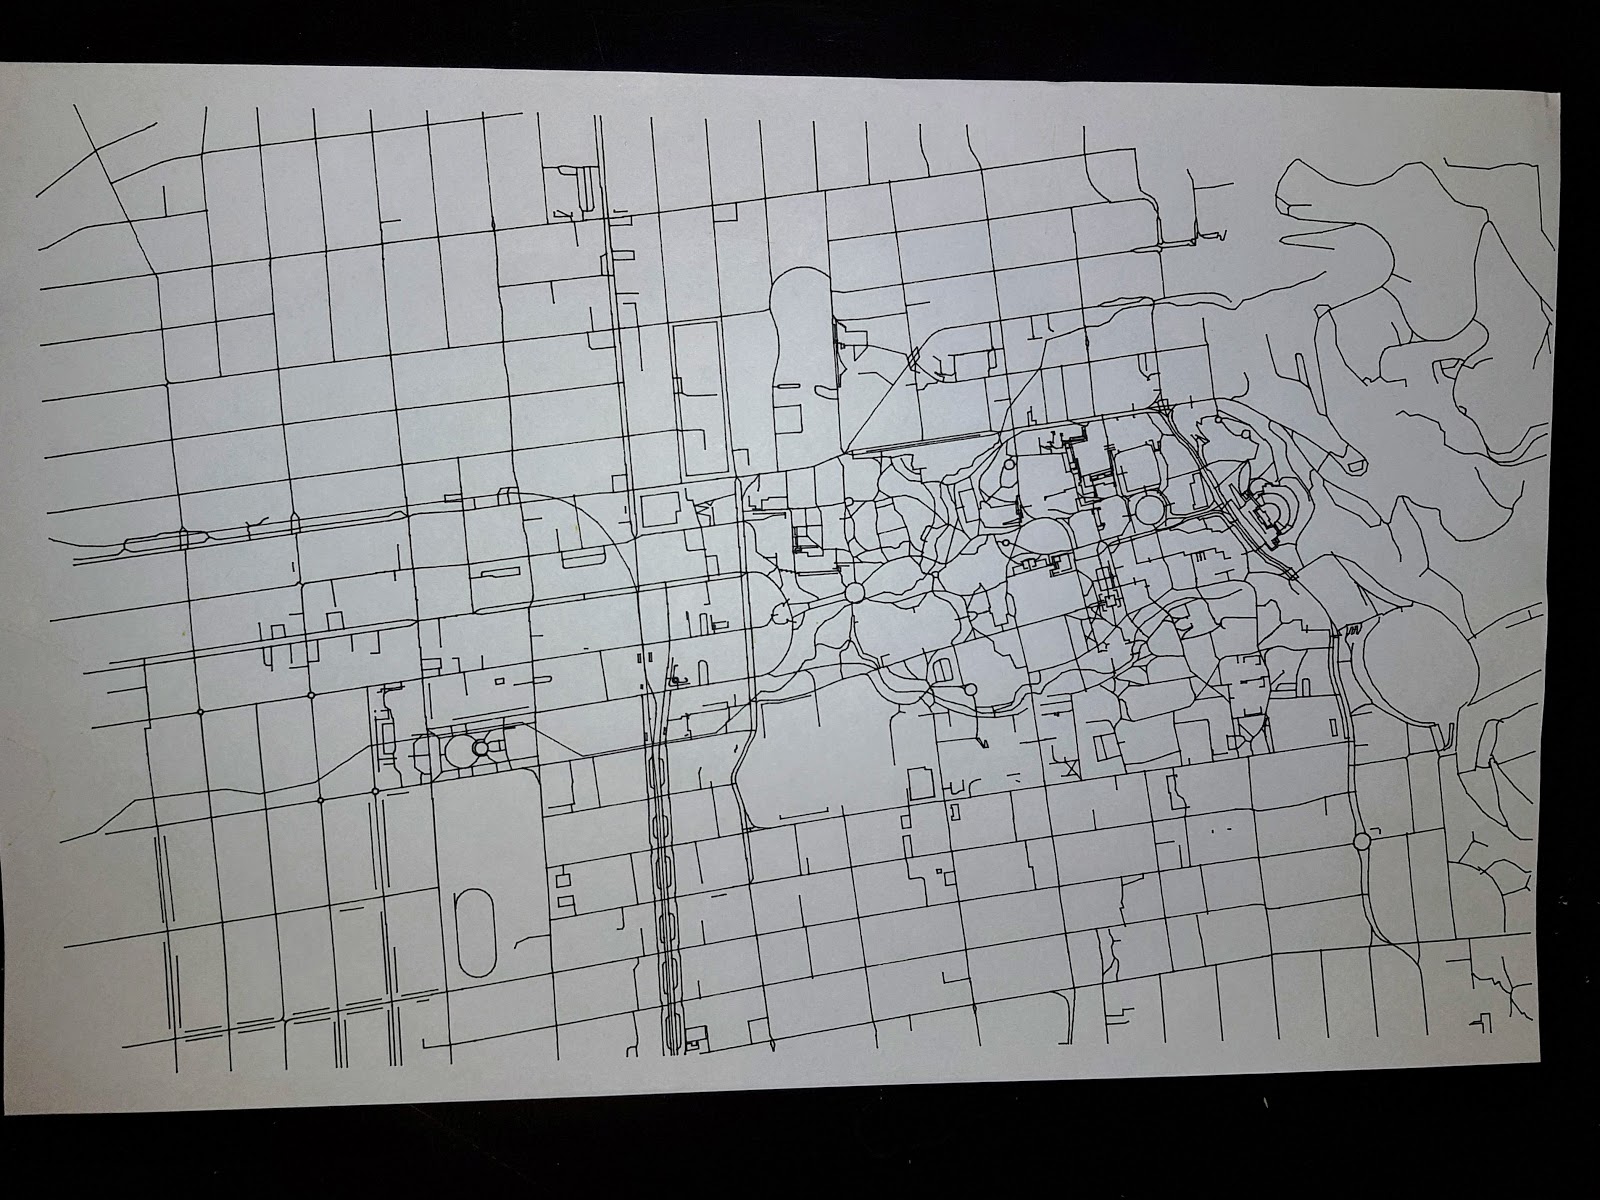
Unfortunately, the polygon layers don’t end up looking very good when simply overlaid on top of the roads layer (I neglected to take a photo of this; you’ll have to take my word for it), since they’re just rectangular outlines that are difficult to see next to the black lines of the roads.
If we want to display the land-use layers in a legible way, we’ll need to get a little creative. How about turning those polygons into hatching lines?
Creating Hatching with Adobe Illustrator
I decided to use Adobe Illustrator to generate the hatching lines, but me not being an Illustrator expert by any means, I spent many hours fruitlessly trying different tools to no avail. The issue was that I needed to create a PS file with just the lines themselves – no hatching patterns defined, no masking layers – because the HPGL dialect spoken by the HP 7475A (as opposed to the later, more sophisticated HP-GL/2) doesn’t support any of these fancy features.
I finally gave up on figuring this out on my own, and asked Stack Exchange, where I got my answer.
The workflow I finally settled on is a bit convoluted, but it does work:
- Load the PS file corresponding to a single layer in Illustrator (using
pdf2psto generate the PS from the QGIS PDF export). - Remove the background layer to leave just the layer with the polygon paths.
- Select the remaining layer. If there are multiple paths, use Pathfinder | Unite.
- With the layer still selected, create a compound path with Object | Compound Path | Make.
- Fill the path with a pattern I made of diagonal strokes, and remove the stroke outline.
- Adjust the spacing of the hatching lines as desired with Object | Transform | Scale (with only “Transform Patterns” checked).
- Convert the compount path to a group of hatching lines with Object | Expand and then Object | Path | Outline Stroke.
- Release the clipping mask: Object | Clipping Mask | Release.
- Select everything and click Pathfinder | Crop in the Properties panel.
- Finally, export the result back to PS by printing to Postscript using the “Device Independent” PPD. I then converted the PS file to HPGL using a modified version of my
pdf2hpgl.shscript that simply skips thepdf2psstep.
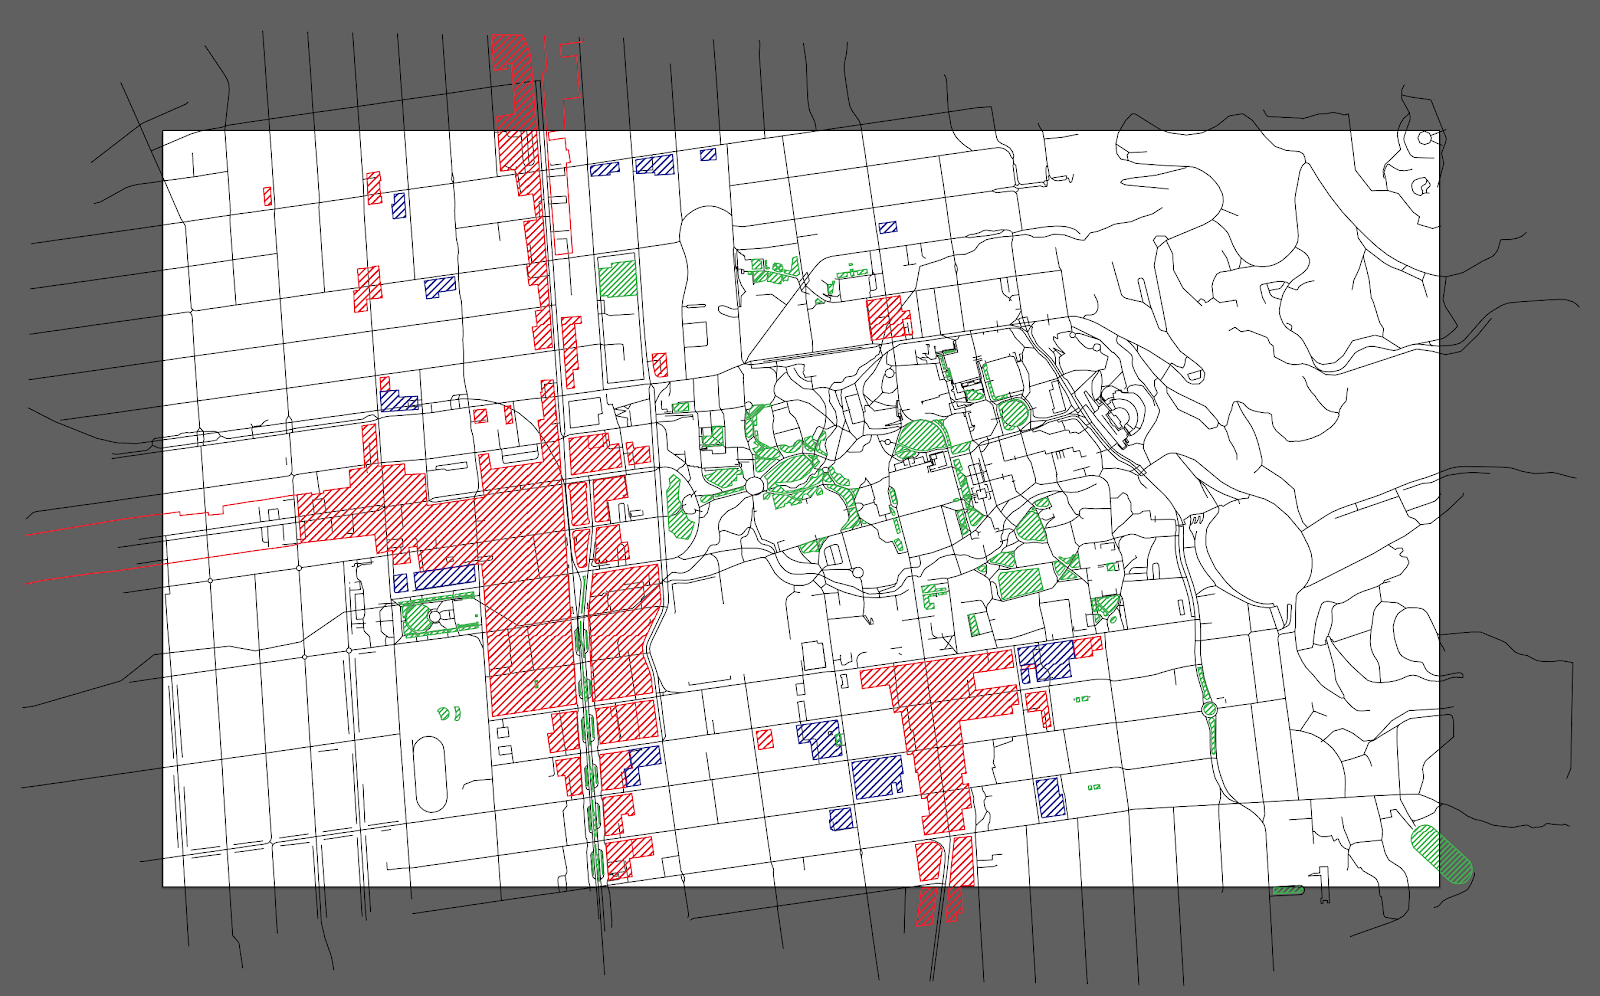
Here’s what it looks like when I plot the resulting hatch lines for just one layer (the “commercial” layer):
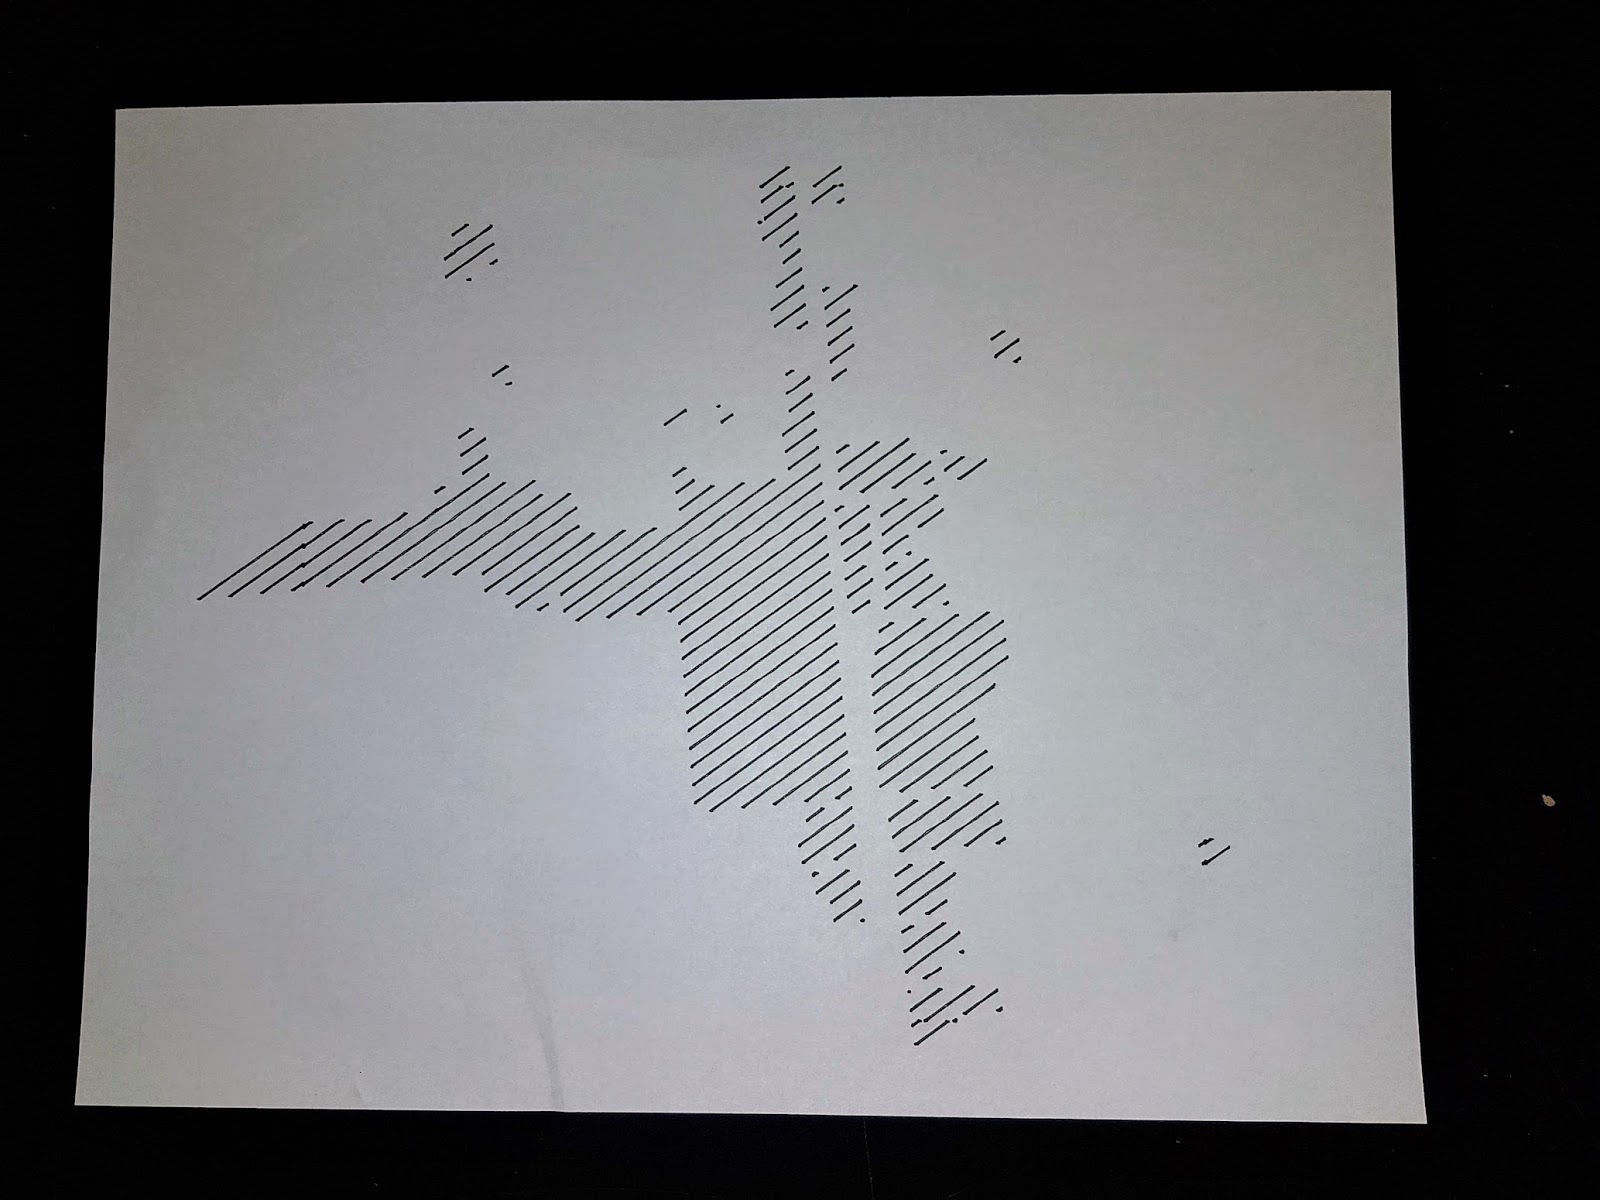
Not bad, huh?
Once we have hatching for one layer working, we can do the rest of them just by repeating the process for each layer. I did have to carefully align each layer together in Illustrator (and then print them out to Postscript one at a time by selectively hiding layers):
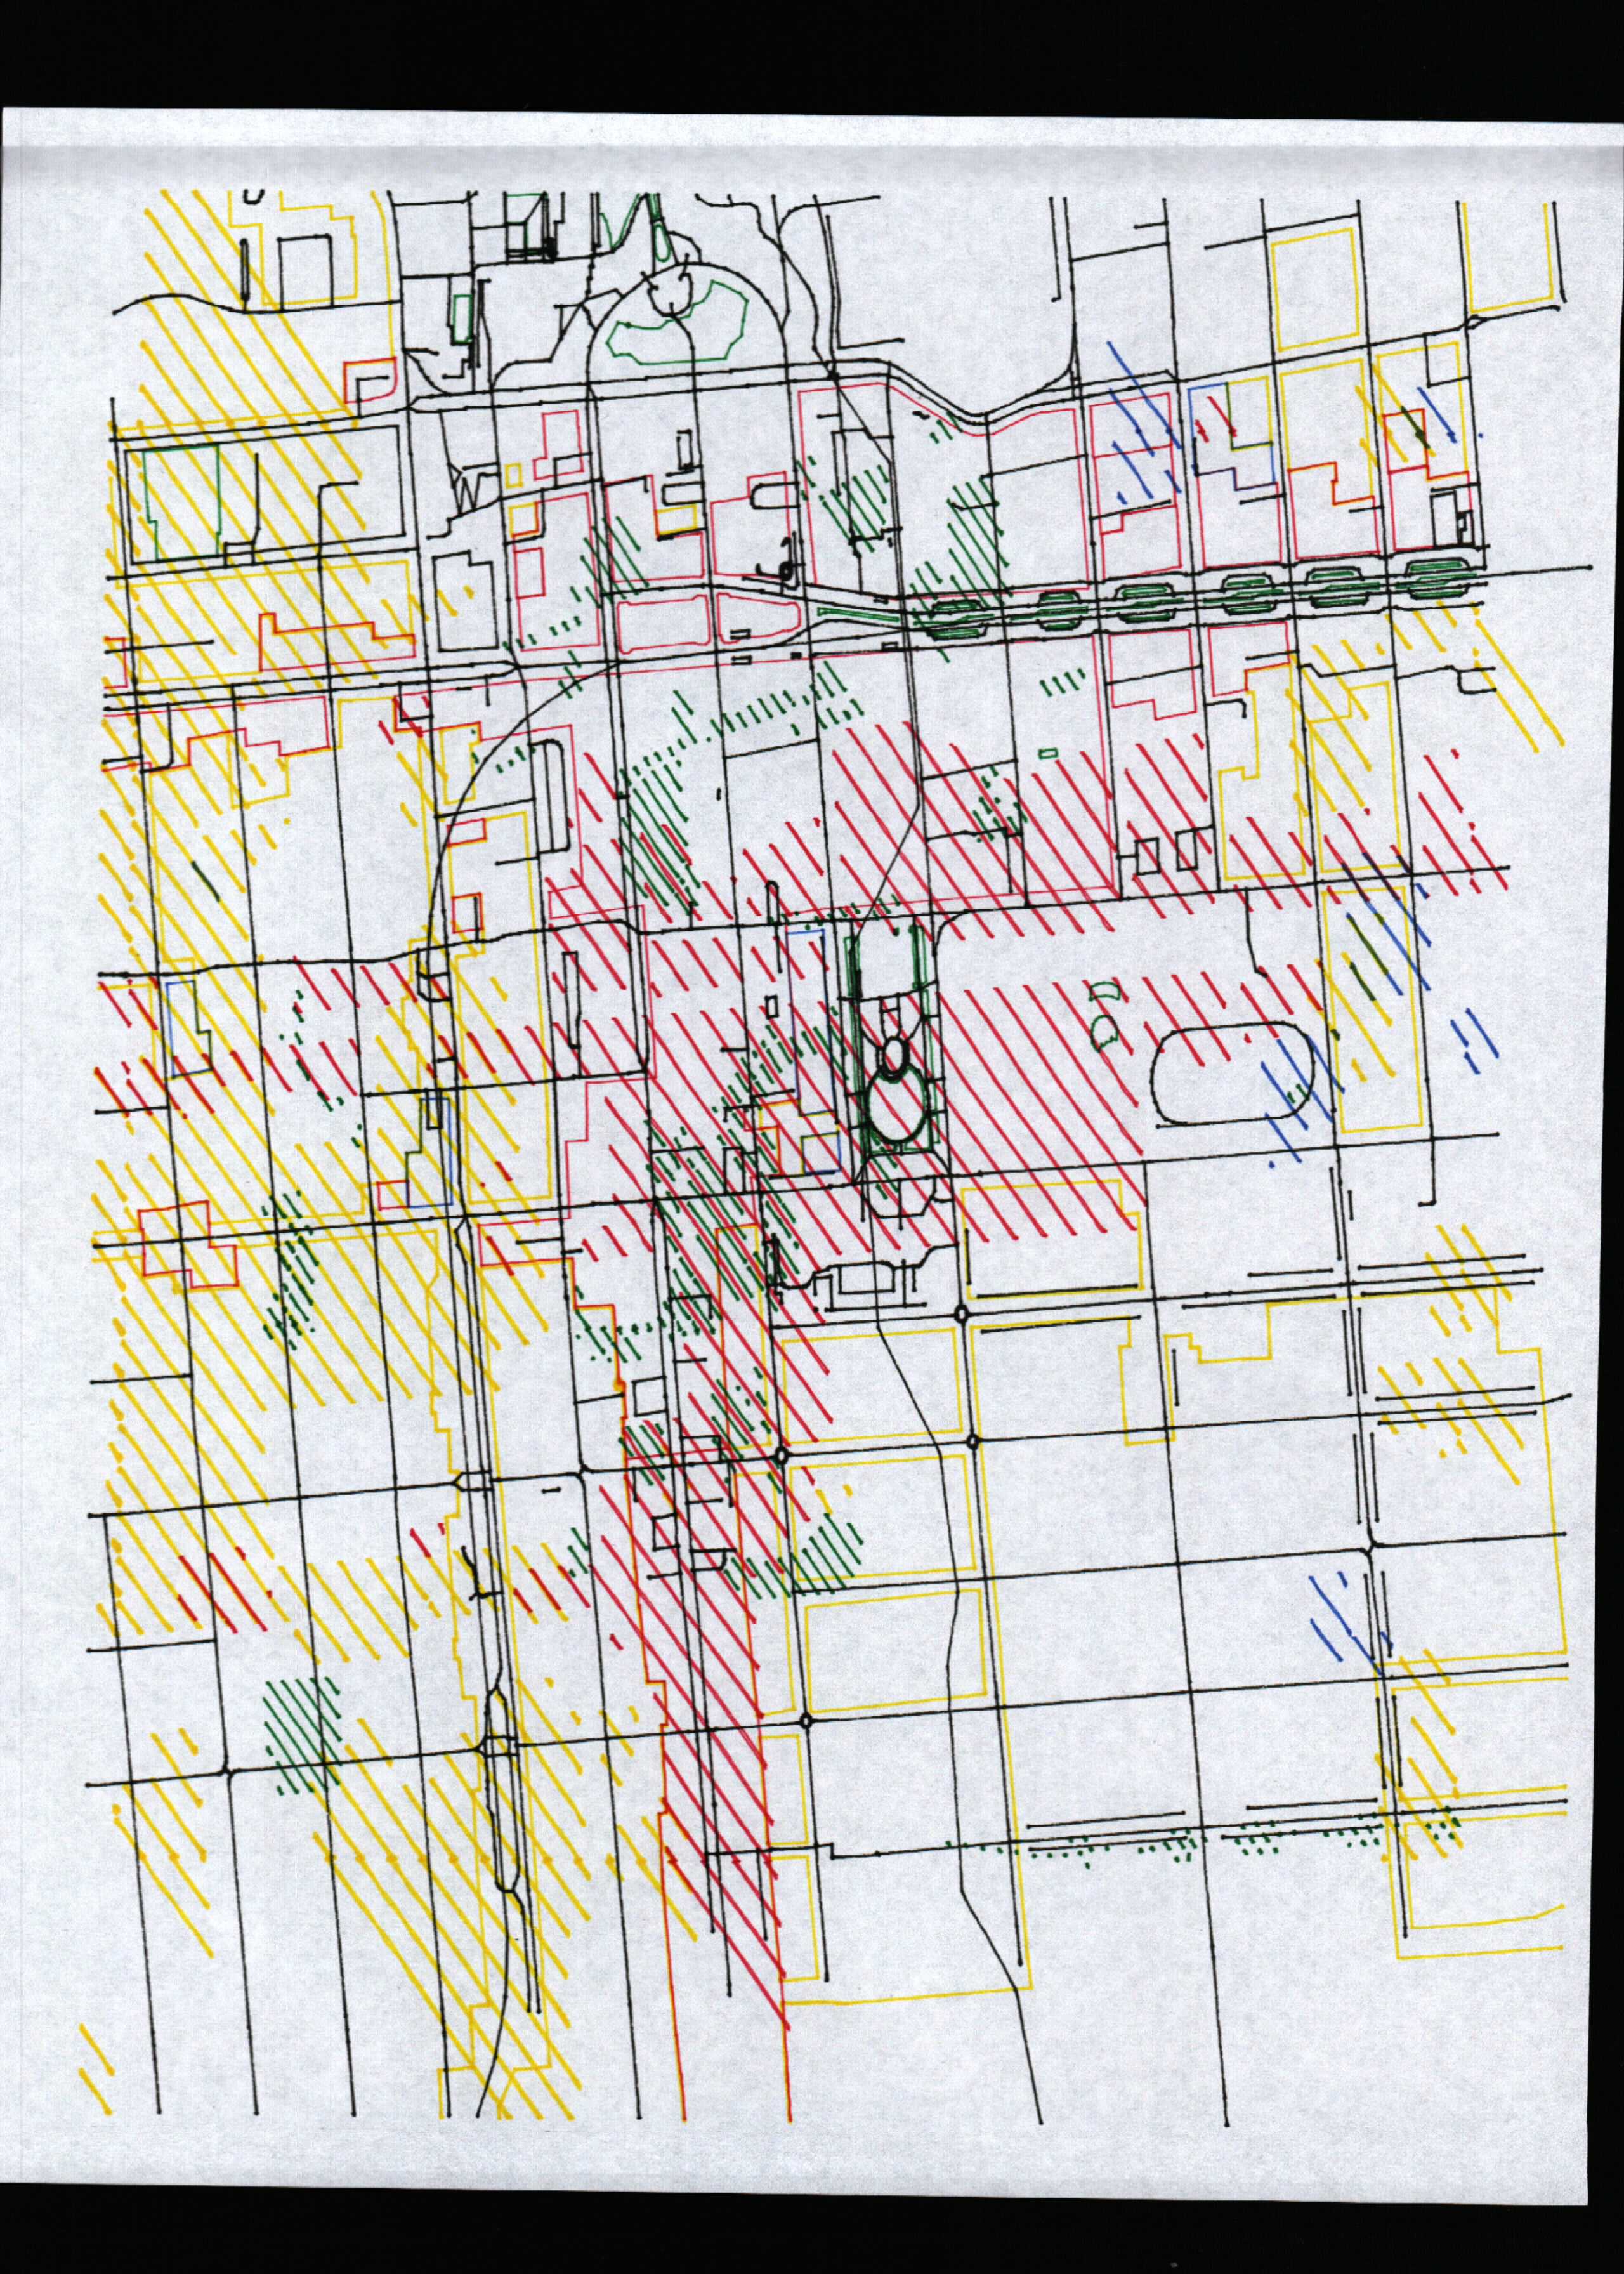
That said, you can create some cool glitchy art by neglecting to properly align the layers:
The Final Product
I ran plot_hpgl_file.py and crossed my fingers. After 10 minutes of meticulous plotting, the map came out of the plotter, and actually looked halfway decent. I added some text and carefully cut the paper from 11”x17” to 11”x14” to reduce the amount of unsightly white space at the bottom:
Not perfect, but it’s certainly not bad for a week’s work.
I haven’t had the chance to do much else with the pen plotter yet, but hopefully this gave you a taste of what these little robots can do. And who knows, maybe I can inspire someone else to save a plotter from a junkyard, like Tobias Toft’s article inspired me. (Just watch out for the dreaded HP-IB port…)
Comments
blog comments powered by Disqus